
Pizza might be one of America’s most universal foods, but how people order it is anything but uniform. From crust and sauce to toppings, sides, and even dipping preferences, pizza choices vary widely depending on where you live. Some states stick to the classics, while others show clear preferences that set them apart from the rest of the country.
To better understand these differences, High Risk Pay surveyed over 2,100 Americans across the country to see how they really take their pizza. The survey results show clear state-by-state patterns, spanning favorite pizza styles and chains, ordering habits, and annual pizza spend. Together, the data shows just how divided (and occasionally united) Americans are when it comes to pizza.
Fresh Out of the Oven: Key Takeaways
- The most common pizza order nationwide includes a classic crust, red (tomato) sauce, mozzarella cheese, pepperoni, mushrooms, no dipping sauce, and chicken wings on the side.
- While pepperoni is the top pizza type for Americans overall, supreme and meat lover’s pizzas lead in several states, and New York is the only state to favor Margherita pizzas most.
- Nearly two-thirds of Americans (63%) say pineapple belongs on pizza, with most respondents naming it as their favorite unique topping on pizza.
- Nearly one in four Americans eats pizza at least once a week, with the highest weekly consumption reported in midwestern states: Ohio, Wisconsin, Michigan, and Minnesota.
- Americans spend an average of $383.14 on pizza each year, with Michigan ($522.02), New York ($496.35), Ohio ($494.16), and Minnesota ($479.12) spending the most.
Americans Bake Their Perfect Pizza Pie
Across the country, Americans tend to agree on what makes a solid slice. Looking at national results, the most common pizza order in the U.S. features a classic crust topped with red (tomato) sauce, mozzarella cheese, and pepperoni, with mushrooms as the most popular vegetable topping. When it comes to extras, most Americans prefer no dipping sauce, and chicken wings are the most frequently chosen side dish.
That national combination shows up consistently at the state level, with many states aligning closely with the overall average. Still, a few preferences stand out when comparing results across the country.
Crust choices show clear regional variation. While classic crust leads nationally among respondents, thin crust emerges as the top choice in several states, including Connecticut, Illinois, Massachusetts, Missouri, New York, and Tennessee. Illinois’s preference for thin crust is somewhat ironic given the state’s love for Chicago-style deep-dish pizza.
Sauce and cheese preferences are far more uniform. Red (tomato) sauce dominates in every state included in the survey, and mozzarella is the top cheese choice nationwide, with no state favoring an alternative cheese overall.
Pepperoni is the most popular meat topping in most states, though sausage leads in six states, including Arkansas, Delaware, Illinois, Minnesota, Rhode Island, and Wisconsin. On the vegetable side, mushrooms appear most frequently as the top choice, while onions, black olives, and bell peppers surface as leading options in a few states. And most Florida and Texas residents prefer no veggies on their pizza at all.
Dipping sauces reveal one of the closer splits in the data. While skipping a dipping sauce altogether ranks first nationally, garlic butter takes the top spot in 19 states—many of them in the South, including Florida, Georgia, Louisiana, and North Carolina. In third place, ranch is the top preference in 11 states, including Idaho, Montana, Nevada, New Mexico, and Oregon. It’s clearly the go-to dipping sauce in the West.
Side dish preferences also skew savory. Chicken wings (23%) and breadsticks (22.8%) are the most common accompaniments to pizza orders, while salad (20.7%) ranks closely behind. Sweet options trail far behind, with cinnamon sticks and dessert pizza ranking last nationally, indicating that most Americans prefer to keep pizza meals firmly on the savory side.
America’s Favorite Pizza Types & Pizza Chains
Looking at the most popular pizza styles nationwide, pepperoni ranks first overall with 20.2% of Americans labeling it as their favorite, narrowly edging out supreme pizza (19.3%), which includes multiple toppings like pepperoni, sausage, peppers, and onions. Meat-lover’s pizza follows (11.5%), while veggie-forward options and specialty styles make up a smaller share of preferences at the national level.
At the state level, pepperoni is the most common favorite, leading in many states across the country. Supreme pizza also appears frequently, where states such as Alabama, Arizona, Georgia, Louisiana, North Carolina, Tennessee, Virginia, and Wisconsin list it as their top choice.
A few states stand out for favoring other styles. Kansas, Kentucky, Mississippi, Missouri, South Carolina, and Utah prefer meat lover’s pizza, while Hawaii, Minnesota, and Montana are the only states where Hawaiian pizza (ham and pineapple) ranks first. New York is the only state to name Margherita pizza as its favorite style.
When it comes to pizza chains, Domino’s leads nationally with 26.7% of Americans reporting it as their go-to, followed by Pizza Hut (23.8%) and Papa John’s (18.7%). This pecking order is reflected across much of the U.S., with Domino’s appearing as the top chain in a majority of states.
Regional preferences still appear in several states. California favors Round Table Pizza, a chain founded in Menlo Park and long rooted in the Golden State, while Michigan prefers Jet’s Pizza, the Detroit-style deep dish brand that got its start in Sterling Heights. Georgia, Montana, Nevada, Tennessee, Utah, and Virginia list Papa John’s as their top chain. Papa Murphy’s leads in Minnesota.
Pineapple is America’s No. 1 Choice for Unique Pizza Toppings
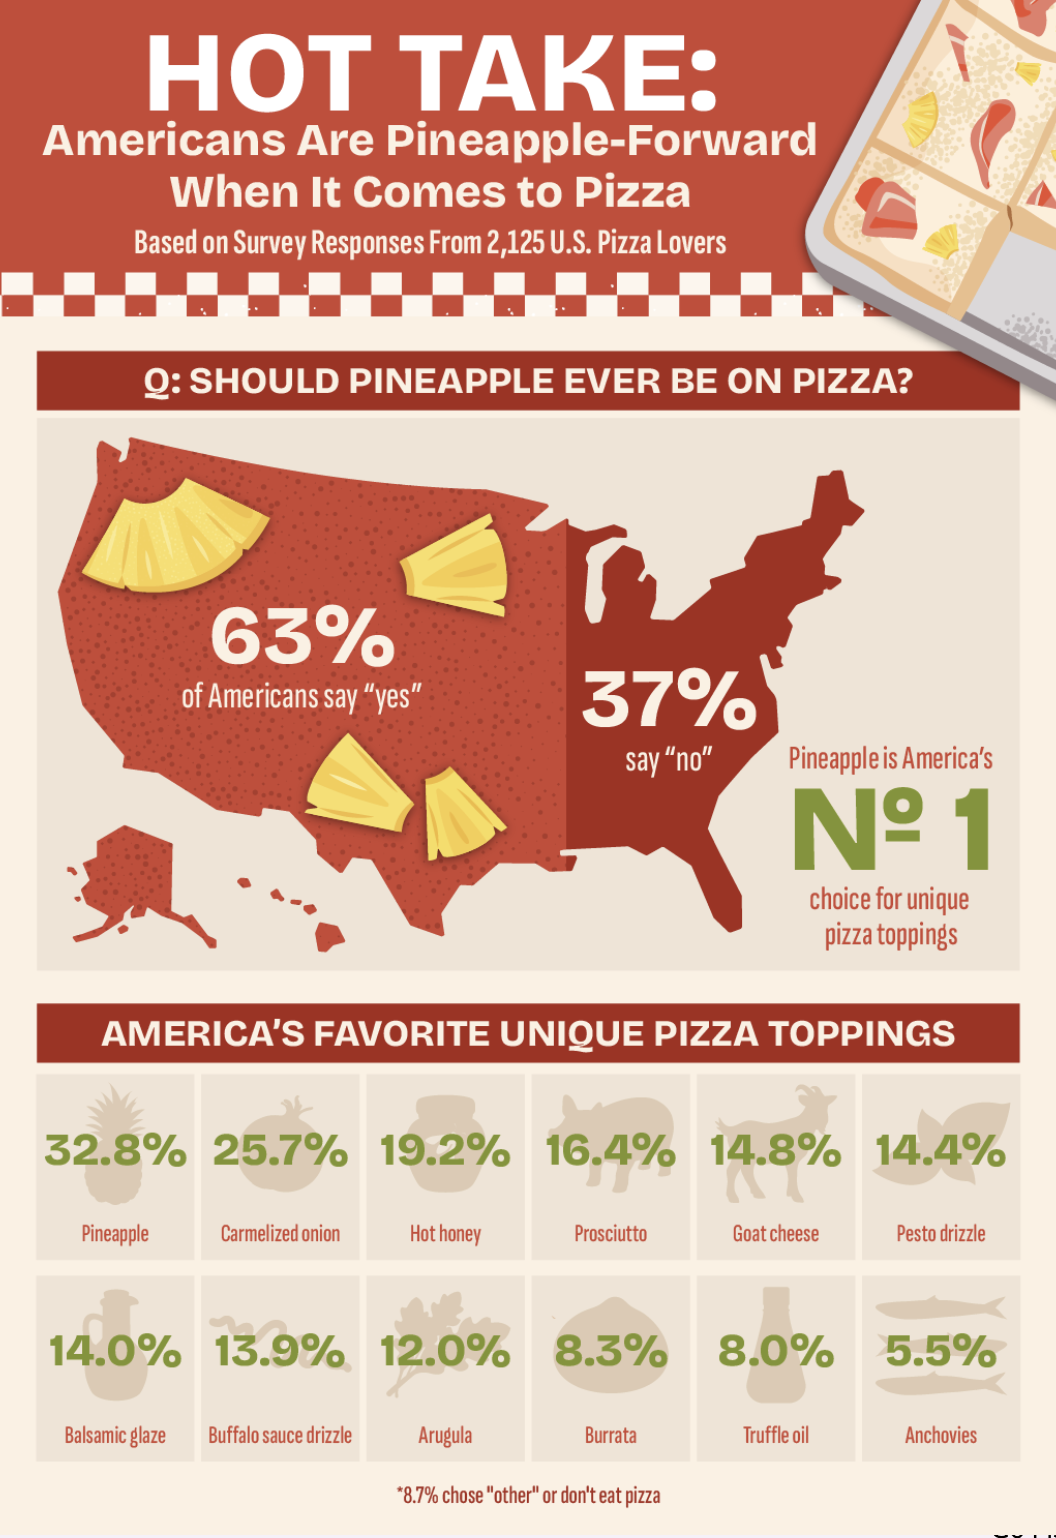
Despite its reputation as a controversial topping, pineapple has more fans than critics among Americans. When asked whether pineapple should ever be on pizza, nearly two-thirds of Americans (63%) said “yes,” while 37% said “no.”
In a separate question about favorite unique toppings, pineapple again came out on top. Pineapple leads with 32.8%, followed by caramelized onions at 25.7%.
Several other toppings cluster closely behind. Hot honey (19.2%) and prosciutto (16.4%) appear most frequently, followed by goat cheese (14.8%), pesto drizzle (14.4%), balsamic glaze (14.0%), and buffalo sauce drizzle (13.9%). Greens and specialty cheeses, including arugula (12.0%) and burrata (8.3%), also register notable interest.
More niche toppings fall toward the bottom of the list. Truffle oil (8.0%), anchovies (5.5%), figs (5.2%), and egg (3.0%) are selected by a smaller share of respondents.
America’s Pizza Profile: From Slices to Spending

Looking at how often Americans eat pizza, the largest share (39%) says they eat it a few times per month. Nearly one in four Americans (24%) reports eating pizza at least once a week. States with the highest share of respondents who eat pizza at least once a week are Ohio (46%), Wisconsin (41%), Michigan (34%), and Minnesota (33%).
When it comes to spending, Americans report spending an average of $383.14 on pizza each year. Annual spending is highest in Michigan ($522.02), Minnesota ($479.12), New York ($496.35), and Ohio ($494.16).
Pizza portions are also fairly consistent nationwide. Most Americans (39%) eat three slices of pizza in one sitting, while 23% eat four slices or more. States with the highest share of respondents eating four or more slices per sitting are Minnesota (47%), Texas (43%), Rhode Island (36%), and Illinois (35%).
When asked which states have the best pizza, a majority of respondents point to New York (57%). Illinois follows at 20%, with California (5%) and Connecticut (3%) rounding out the top responses.
Closing Thoughts
All of this points to one thing: Americans don’t just order pizza, they personalize it. From custom pies to extra sides and repeat orders, pizza has become a go-to example of how people expect convenience and flexibility when ordering food online.
For restaurants and delivery platforms, those habits translate into busy order flows, frequent add-ons, and customers who expect checkout to be fast and friction-free every time. That’s where payment infrastructure quietly does the heavy lifting. High Risk Pay works with food delivery businesses to support payment processing that keeps pace with high order volume and repeat customers—so the focus stays on the food, not the checkout.
Methodology
This study is based on responses from 2,125 U.S. adults, aged 18 to 78 years old, conducted from December 8–12, 2025. Respondents answered questions about their pizza preferences, ordering habits, and spending behavior, including crust and topping choices, favorite pizza styles and chains, and how often they eat pizza.
State-level results reflect the most common response within each state. Alaska, North Dakota, South Dakota, Vermont, and Wyoming were excluded from state-level analysis due to a limited number of survey responses.
Fair Use
You are welcome to use, reference, and share non-commercial excerpts of this study with proper attribution. If you cite or cover our findings, please link back to this page so readers can view the full methodology, charts, and context.